Flexi Cap Funds: An Apt Choice During Volatile Times
Rounaq Neroy
Mar 11, 2025 / Reading Time: Approx. 8 mins
Listen to Flexi Cap Funds: An Apt Choice During Volatile Times
00:00
00:00
Considering this, I suggested investing in Flexi Cap Fund over Multi Cap Funds, as the former held a higher allocation to large-caps (around 60%-65% of the net assets of the scheme). This was tactically proposed not ruling out the downside risk if Indian equities were to correct and the chances of small-caps and mid-caps witnessing greater drawdown than the large-cap counterparts.
Table 1: Correction Since the Peak
| Particulars |
S&P BSE SENSEX |
S&P BSE Mid-Cap |
S&P BSE Small-Cap |
| All-time high (Dates) |
26-Sep-2024 |
24-Sep-2024 |
11-Dec-2024 |
| All-time high level (in points) |
85,836.12 |
49,621.69 |
57,703.48 |
|
|
|
|
| Level as of Jan 1, 2024 (in points) |
72,271.94 |
37,036.77 |
42,986.53 |
| Level as of Mar 06, 2025 (in points) |
74,340.09 |
40,009.30 |
45,265.29 |
|
|
|
|
| Correction since the all-time high (%) |
-13.4% |
-19.4% |
-21.6% |
Data as of March 6, 2025
(Source: ACE MF, data collated by PersonalFN Research)
As a matter of fact, eventually, the bellwether BSE Sensex and the Mid-Cap Index peaked in September 2024, while the BSE Small-Cap Index continued to scale up until December 2024.
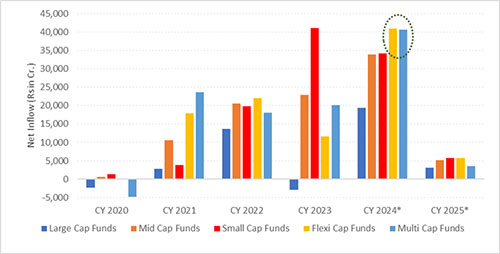
In CY2024 Mid Cap Funds and Small Cap Funds remained the favourite of investors (despite frothy valuations). But it was also satisfying to see some investors taking exposure to Multi Cap Funds and Flexi Cap Funds. The net cumulative inflows into Flexi Cap Funds in CY2024 were slightly higher than Multi Cap Funds (see Graph 1).
Graph: Net Cumulative Inflows into Flexi Cap Funds Were Slightly Higher
 Data as of January 2025
In the case of inflows in sub-categories of diversified equity funds, the segment-wise data reported by AMFI is from April 2019 onwards.
(Source: AMFI, data collated by PersonalFN Research)
In the CY2025 now with market volatility intensified, attributed to a variety of global and domestic factors, plus Foreign Portfolio Investors (FPI) dumping Indian equities; nervousness has set into the market. The BSE Sensex is down -13.4%, the BSE Mid-Cap Index -19.4% and the BSE Small Cap -21.6% from their respective peaks. The bears are tightening their grip.
This has taken a toll on the performance of equity-oriented mutual funds. On average, the Multi Cap Funds Flexi Cap Fund, as sub-categories, are down nearly -16.0% each from the peak of the BSE Sensex.
That being said, the drawdown in the case of Flexi Cap Funds is lesser than Multi Cap Funds (as of March 6, 2025). The key reason for this is that Flexi Cap Funds have consistently held a large-cap biased equity portfolio sighting margin of safety therein and have been quite tactical and picky when approaching mid-cap and small-caps.
But such an approach has also led to a bit of underperformance of Flexi Cap Funds as a sub-category compared to the Multi Cap Funds. Concurrently, if one were to choose a Flexi Cap Fund sensibly and invest in some of the best schemes, one would have still been able to beat the category average returns and the benchmark indices. This is evident from the stark difference in the top performer, bottom performer, and category average returns of Flexi Cap Funds.
Table 2: Performance of Flexi Cap Funds and Multi Cap Funds
| Scheme |
Absolute |
CAGR |
Risk Ratios |
| 6 months |
1 Year |
3 Years |
5 Years |
7 Years |
SD |
Sharpe |
Sortino |
| Flexi Cap Funds |
| Top Performer |
18.47 |
51.52 |
28.61 |
25.97 |
19.82 |
16.51 |
0.29 |
0.57 |
| Bottom Performer |
10.31 |
21.78 |
8.36 |
16.92 |
14.59 |
14.84 |
0.05 |
0.08 |
| Category Average Returns |
12.48 |
31.90 |
17.75 |
20.18 |
15.89 |
15.08 |
0.18 |
0.35 |
|
|
|
|
|
|
|
|
|
| Multi Cap Funds |
| Top Performer |
14.72 |
40.64 |
28.81 |
24.74 |
18.78 |
15.76 |
0.30 |
0.58 |
| Bottom Performer |
12.35 |
33.99 |
19.62 |
21.85 |
15.97 |
15.24 |
0.16 |
0.30 |
| Category Average Returns |
12.56 |
32.75 |
21.99 |
24.14 |
18.47 |
15.38 |
-0.04 |
0.22 |
|
|
|
|
|
|
|
|
|
| Benchmark Indices: |
| NIFTY 500 - TRI |
11.11 |
30.77 |
17.40 |
19.56 |
15.37 |
14.84 |
0.19 |
0.37 |
| NIFTY 50 - TRI |
8.73 |
22.59 |
14.23 |
16.63 |
14.58 |
13.34 |
0.17 |
0.34 |
| BSE SENSEX - TRI |
8.14 |
20.30 |
13.65 |
16.13 |
14.88 |
13.16 |
0.16 |
0.33 |
Data as of March 6, 2024
Returns expressed are rolling returns in % calculated using the Direct Plan-Growth option.
Standard Deviation indicates Total Risk and Sharpe Ratio measures the Risk-Adjusted Return. They are calculated over 3 years assuming a risk-free rate of 6% p.a.
*Please note, that this table represents past performance. Past performance is not an indicator of future returns.
The securities quoted are for illustration only and are not recommendatory.
Speak to your investment advisor for further assistance before investing.
Mutual Fund investments are subject to market risks. Read all scheme-related documents carefully.
(Source: ACE MF, data collated by PersonalFN Research)
Multi Cap Funds, on the other hand, due to their cumulative 50% allocation each to mid-cap and small caps (25% to mid-caps and 25% to small-caps) and the remaining 25% to large caps -- which is required to be followed as SEBI guidelines, regardless of market conditions, valuations, and liquidity among the other factors -- has supported the outperformance of Multi Cap Funds as a sub-category across time periods.
However, since Multi Cap Funds do not have the flexibility to manoeuvre across market cap segments (unlike), there is high risk involved. Table 1 shows that the Multi Cap Funds category has exposed investors to higher risk (as denoted by the Standard Deviation) than Flexi Cap Funds.
Table 3: Performance of Flexi Cap Funds and Multi Cap Funds During Bear and Bull Phases
| Scheme |
Bull Phase |
Bear Phase |
Bull Phase |
Bear Phase |
Bull Phase |
Bear Phase |
Bull Phase |
09-Mar-09 To
05-Nov-10 |
05-Nov-10 To
20-Dec-11 |
20-Dec-11 To
03-Mar-15 |
03-Mar-15 To
25-Feb-16 |
25-Feb-16 To
14-Jan-20 |
14-Jan-20 To
23-Mar-20 |
23-Mar-20 To
 6-Mar-25 |
| Flexi Cap Funds |
| Top Performer |
69.47 |
-37.79 |
29.63 |
-21.56 |
20.65 |
-33.32 |
32.06 |
| Bottom Performer |
75.58 |
-20.11 |
29.55 |
-17.72 |
16.43 |
-30.94 |
23.38 |
| Category Average Returns |
79.33 |
-27.21 |
29.28 |
-18.96 |
16.47 |
-34.29 |
27.74 |
|
|
|
|
|
|
|
|
| Multi Cap Funds |
| Top Performer |
109.42 |
-23.25 |
35.99 |
-22.97 |
14.74 |
-40.63 |
35.72 |
| Bottom Performer |
69.45 |
-31.16 |
34.02 |
-21.04 |
18.24 |
-35.07 |
30.25 |
| Category Average Returns |
87.17 |
-28.96 |
33.74 |
-18.75 |
15.93 |
-35.73 |
31.83 |
|
|
|
|
|
|
|
|
| Benchmark Indices: |
| NIFTY 500 - TRI |
81.67 |
-28.17 |
26.95 |
-20.06 |
16.64 |
-37.84 |
28.33 |
| NIFTY 50 - TRI |
73.59 |
-24.62 |
25.26 |
-21.71 |
17.45 |
-38.27 |
25.95 |
| BSE SENSEX - TRI |
79.43 |
-24.18 |
25.14 |
-21.34 |
18.28 |
-37.91 |
25.12 |
Data as of March 6, 2025
The securities quoted are for illustration only and are not recommendatory.
Direct Plan-Growth option considered.
Returns considered are point-to-point and expressed in %.
Returns over 1 year are compounded annualised; else absolute.
Standard Deviation indicates Total Risk, while Sharpe and Sortino Ratios measure the Risk-Adjusted Return. They are calculated over a 3-Yr period assuming a risk-free rate of 6% p.a
Past performance is not an indicator of future returns.The table above is NOT a recommendation as such. Speak to your investment advisor for further assistance before investing.Mutual Fund investments are subject to market risks. Read all scheme-related documents carefully.(Source: ACE MF; Data collated by PersonalFN Research)
Table 2 shows that while during the bull phases of the Indian equity market where growth investing and mid-caps and small caps are favoured, Multi Cap Funds usually do well (due to 50% allocation to mid-caps and small-caps), during the bear phases or times remarkable market corrections, they tend to fall much more.
In the last brief bear phase of the COVID-19 pandemic, Multi Cap Funds as a sub-category fell more than the Flexi Cap Funds. In the current bull phase of the Indian equity market since the lows of the COVID-19 pandemic, while Multi Cap Funds have fared better, it is important not to get carried away. Remember, past returns are not indicative of future returns.
Going forward if volatility in the Indian equity market intensifies, mid-caps and small-caps would be the first to be impacted. In such a case, Multi Cap Funds would witness more drawdowns and may clock relatively lower returns than the Flexi-Cap Funds.
You see, a key trait of Flexi Cap Funds is as per SEBI guidelines they are mandated to invest a minimum of 65% of their assets in equity and equity-oriented instruments of companies across the market cap range without any upper or lower limit. Due to their versatile investment mandates, they are well-positioned to employ a dynamic investment strategy, investing across various market cap segments based on the market outlook, valuations and liquidity as per the investment opportunities.
Where Should You Invest - Flexi Cap Funds or Multi Cap Funds?
Well, the data says a lot about the type of returns and risk you could expect from these two sub-categories of equity mutual funds.
While India remains a 'bright spot' and a promising investment destination supported by robust fundamentals, a prudent investor should not ignore the headwinds -- geopolitical tensions, tariff tantrums, an uncertain inflation outlook, and weak consumption among other factors that could weigh on the economic growth and corporate earnings.
If the equity market in CY2025 continues to correct, the large-cap allocation in the Flexi Cap Fund portfolio can offer steady growth and a cushion against market volatility.
[Read: Why It Makes Sense to Take the SIP Route Now Amidst a Volatile Equity Market]
On the other hand, if the market bottoms out and the fund manager of a Flexi Cap Funds sees a timely opportunity in smaller companies that again could prove rewarding for investors.
Flexi Cap Funds have the flexibility to increase/decrease exposure to a particular segment depending on market conditions, valuations, and the outlook for the asset class. Owning a Flexi Cap Fund (as well as other suitable types of funds) in your portfolio is a meaningful way to dynamically diversify the portfolio across market caps and sectors while you endeavour to build wealth.
A Flexi Cap Fund is a suitable choice to benefit from the stability of large caps and at the same time boost portfolio growth with the high growth potential of mid and small caps. A Flexi Cap Fund potentially helps limit the downside risk and earn decent risk-adjusted returns. Want to which are the best Flexi Cap Funds for 2025? Watch this video:
If you have a high-risk appetite and an investment horizon of at least 5 years, consider adding/holding a Flexi Cap Fund in the 'core' portfolio would be worthwhile.
Being strategic and prudent in your approach shall pave the path to wealth creation.
Happy Investing!
We are on Telegram! Join thousands of like-minded investors and our editors right now.
-New.png)
ROUNAQ NEROY heads the content activity at PersonalFN and is the Chief Editor of PersonalFN’s newsletter, The Daily Wealth Letter.
As the co-editor of premium services, viz. Investment Ideas Note, the Multi-Asset Corner Report, and the Retire Rich Report; Rounaq brings forth potentially the best investment ideas and opportunities to help investors plan for a happy and blissful financial future.
He has also authored and been the voice of PersonalFN’s e-learning course -- which aims at helping investors become their own financial planners. Besides, he actively contributes to a variety of issues of Money Simplified, PersonalFN’s e-guides in the endeavour and passion to educate investors.
He is a post-graduate in commerce (M. Com), with an MBA in Finance, and a gold medallist in Certificate Programme in Capital Market (from BSE Training Institute in association with JBIMS). Rounaq holds over 18+ years of experience in the financial services industry.
Disclaimer: Investment in securities market are subject to market risks, read all the related documents carefully before investing.
This article is for information purposes only and is not meant to influence your investment decisions. It should not be treated as a mutual fund recommendation or advice to make an investment decision in the above-mentioned schemes.