Share prices have strayed into new unclaimed territory.
The S&P BSE Sensex continues to make new all-time highs.
Investors are nonchalant as they ride the bull market into uncharted waters.
The momentum in the the stock market keeps it buoyant, even though a certain set of investors have started to become wary.
Yes, the euphoria of the current market is eerily similar to the stock market exuberance a decade ago.
In January 2008, the BSE Sensex had then touched an all-time high of 20,873. In a matter of few weeks, the index was down 5,000 points or 25% to under-15,000. Over the next one year, the market crashed to a multi-year low of 8,160——down nearly 60% from the January peak.
2008-2014: The S&P BSE Sensex Struggle Over 6 years
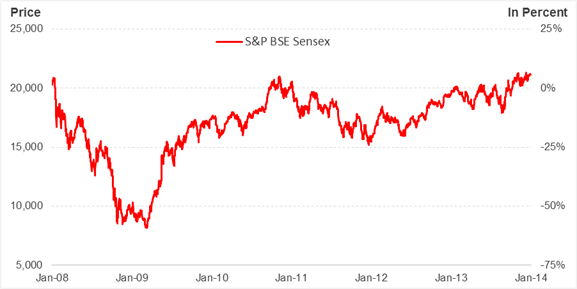
Data as on January 1, 2014
(Source: BSE India, PersonalFN Research)
Those who had invested in the market at the peak can still feel the brunt of the market crash that followed.
Though the market bounced back in a couple of years, and hit a new peak of 21,000 in November 2010. The rally was unsustainable and the Sensex continued to move flat.
2014-2018: S&P BSE Sensex Rallies To New Heights
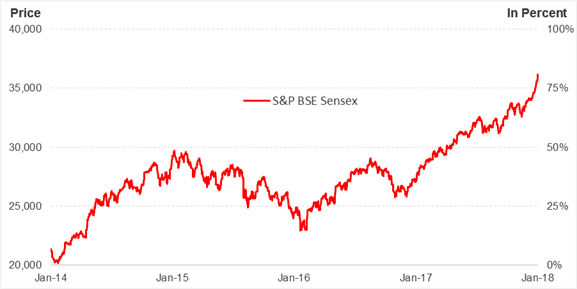
Data as on January 23, 2018
(Source: BSE India, PersonalFN Research)
It wasn’t until November 2013, when the Sensex began to march ahead of the 21,000 mark. Over the next two years or so, the market neared the 30,000 mark. After a brief fall in 2015, the 30-stock index continued its upward trajectory over the next couple of years.
Why do we bring this up?
Well, in times of jubilation one tends to forget the past.
Some may have forgotten that the market had tanked by over 50% in 2008-09. Many others may fail to recall that the index declined by nearly 20% in 2015.
No, we are not trying to scare you. Our guess about the market direction over the next few years is just as good as yours.
But, given the high market prices and equally unjustifiable valuations, we need to be prepared for the unknown.
Is this time different for the stock market?
Analysing some past data, we find that each time the CNX Nifty 50 breached a Price-to-earnings (P/E) of 25x, the market headed for a correction.
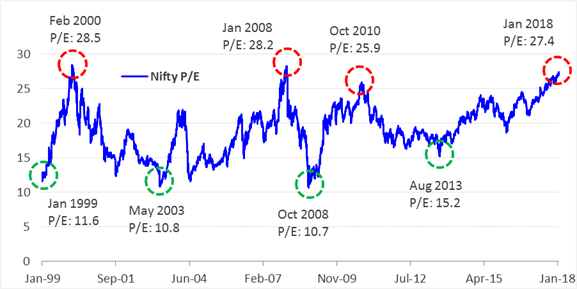
Data as on January 23, 2018
(Source: BSE India, PersonalFN Research)
As can be seen in the chart above, the Nifty P/E breached the 25x mark twice in the past decade. Each time, the market corrected. The crisis in 2008-09 was severe because of the global market meltdown. Baring this exception, the market corrected by about 25% on the other occasion when earnings failed to keep up pace.
Are we headed into a stock market crisis?
Well, some experts seem to differ. According to them, the market is in an earnings cycle recovery. This means, an economic recovery will lead to a higher growth in earnings that will justify the higher market valuations. However, if earnings do not meet expectations, it would be a very undesirable situation.
Some state that it is unfair to compare the historic P/E. Mainly because today’s composition of the Nifty 50 index is vastly different from what it was a decade ago. In 2008, the bulk of the sector weightage was towards energy and petroleum stocks. With time, the weightage has shifted to the financial services sector, as can be seen in the tables below.
Nifty 50-Sectoral Weightage – 2008 & 2018
| Nifty 50 Constituent Sectors |
Weightage - January 2008 |
| Refineries |
15.00% |
| Banks |
11.46% |
| Telecommunication - Services |
11.26% |
| Computers - Software |
9.28% |
| Oil Exploration |
8.30% |
|
| Nifty 50 Constituent Sectors |
Weightage - January 2018 |
| Banks |
26.35% |
| Computers - Software |
11.39% |
| Refineries |
10.53% |
| Automobiles - 4 Wheelers |
7.86% |
| Finance - Housing |
7.66% |
|
Data as on January 1, 2018
(Source: NSE India, PersonalFN Research)
Nevertheless, despite the change in dynamics, it will be wise not to ignore the high valuations. Banks and financial services, due to the growing NPAs problems, pose a grave risk. If there is a correction in these sectors, it is likely to influence sentiments that will affect the broader market. At high valuations, we’ve seen that stocks are more sensitive to economic events and indicators, both domestic and global. Hence, high volatility cannot be ruled out.
The Indian economic environment today
India, among the other markets is in a superior position with its stable government pushing reforms, which brightens the prospects of clocking better economic growth and attracting foreign investments. GST, for example, has the potential to add 2.0-2.5% to the Indian economic growth. Focus on infrastructure development by the current dispensation has the potential to unlock economic growth.
India has a greater demographic advantage than many other nations. The government now has to implement the reforms efficiently and stay on the path of fiscal consolidation.
For the current fiscal year, the fiscal deficit target is 3.2% of the GDP. But given the mammoth of expenditure, it will miss the target. The government seems to be entering uncharted territory and at the given rate, walking the tight-rope of fiscal consolidation will be a challenge. It plans to lessen the fiscal deficit to 2.5% of the GDP by 2023, while reducing the debt-to-GDP to 60% by 2023.
The Ministry of Statistics and Programme Implementation (MOSPI) in its first advance estimates has reduced the GDP growth rate to 6.5% (a 4-year low) for this fiscal year from 7.1% of the last fiscal year. Gross Value Added (GVA) growth––––a refined parameter which excludes taxes and subsidy––––is forecasted 6.1% as against 6.6% last year.
The RBI has retained its projection of GVA growth for 2017-18 of the October resolution at 6.7%; although, it has taken cognisance of increasing oil prices negatively impacting the margin of firms and overall growth.
Fitch (an international rating agency) has pruned India’s growth estimates for FY18 to 6.7% from 6.9% and 7.4% earlier, citing that the rebound was weaker than expected. The agency estimates that India’s GDP growth will be clipped at an average of 6.7% over the next five years.
The International Monetary Fund (IMF), more optimistic than the others, projected India’s GDP growth rate at 7.4% in 2018 and 7.8% in 2019. Thus, making India the fastest growing economy. China, during the same period, is expected to grow at 6.8% and 6.4% respectively, the IMF said.
At the same time, rising crude oil prices, climbing inflation and other geopolitical events pose additional risks to the economy and the market.
Hence, you need to adopt a prudent approach when investing in equity.
What should be your investment strategy?
PersonalFN acknowledges the fact that the Indian equity market is at its peak, and one should buy low and sell high, a basic tenet of investing. However, waiting on the sidelines for the market to correct will be an imprudent strategy.
When the Sensex breached the 30,000 mark in April 2017, the all-time high then, those who were expecting a correction would have been disappointed. As we know it, the Sensex has gone on to hit the 36,000 mark with impunity. Investors who did not jump in then, would have lost out on returns as much as 20%. That is, had they invested Rs 1 lakh then, they would now be sitting on gains in excess of Rs 20,000.
Read: Missed The Sensex Rally? Here’s Another Opportunity To Score Big
But then again, this is all good in hindsight. No one knew for sure that the Sensex would rally by another 20%.
Hence, one needs to devise a strategy in order to mitigate risk and at the same time not miss the wealth creation potential of equity.
Thus, you ought to adopt a sensible approach, rather than being swayed by exuberance and taking the bull market by its horns. If you take the
Systematic Investment Plan (SIP) route, invest regularly from the market peak, and continued for the long term, you would be sitting on substantial gains.
A monthly SIP works best if the market undergoes a correction during the
SIP investment phase. If it does, you will be able to lower the average cost. Had you made a lumpsum investment, there would be no way to average out your costs if the market corrected.
Have a look at a three-year market period in which it was an ideal time to invest via a SIP. We assume an investment of Rs 5,000 every month. The NAV is based on the movement of the S&P BSE Sensex.
Mutual Fund SIPs Over Bear Phases Work Best
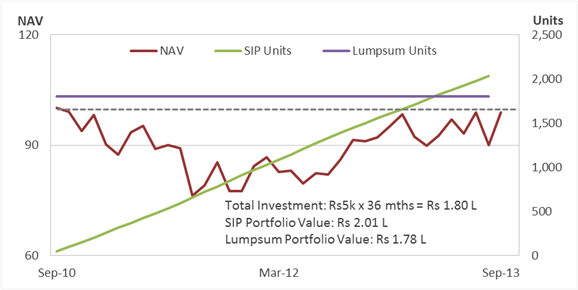
Data of S&P BSE Sensex between September 1, 2010 and September 1, 2013
(Source: www.bseindia.com, PersonalFN Research)
As seen above, when the market dipped, there was ample of opportunity to lower your cost. Thus, at the end of the period, the SIP portfolio delivered decent return, while the lumpsum portfolio failed to deliver any gains as the NAV closed just below the purchase price.
In times of euphoria, a SIP would undoubtedly be a prudent route as compared to investing your corpus as a lumpsum or completely avoiding equity investments.
Mutual Fund SIP Investment Over The Past Five Years
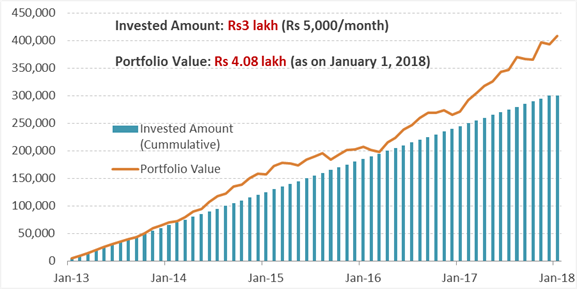
Data of S&P BSE Sensex between January 1, 2013 and January 1, 2018
(Source: www.bseindia.com, PersonalFN Research)
As seen in the past five years, as the market rallied to new heights, an SIP investment would have generated a return of about 12% compounded if we use the values of the Sensex. A top equity mutual fund would have generated a return in excess of 15% over the same period via a SIP.
Remember,
investing in equity requires discipline, patience, and perseverance. If you are looking to make quick returns, then sadly you could end up burning a hole in your pocket.
In addition, SIP is only a method of investing in mutual funds. To support this investment method, you also need to pick the right mutual funds. PersonalFN offers a report titled "
The Super Investment Portfolio – For SIP Investors."
With hundreds of equity funds available, how do you pick
winning mutual funds for your portfolio? Indeed; you need access to unbiased research-backed guidance that helps you select the best equity mutual fund schemes.
After a rigorous shortlisting process, PersonalFN’s Mutual Fund Research Team goes a step ahead when selecting funds that are SIP-worthy. Under this, PersonalFN conducts a detailed analysis on how SIPs in the top shortlisted funds have performed across multiple market conditions and timeframes. Only those funds that successfully pass this evaluation are suggested.
You can read more about the report and the subscription details here:
The Super Investment Portfolio – For SIP Investors.
|
Try our SIP Calculator to find future value of your SIP contributions.
|
Add Comments