 (Image source:pixabay)
Almost a year ago, Infrastructure Leasing & Financial Services (IL&FS) and its group companies were downgraded by the credit rating agencies because it had approximately Rs 1 lakh crore worth public debt on its books. Due to this, the company had difficulty repaying loans and had been borrowing heavily.
[Read: How IL&FS Rating Downgrade Will Impact Your Mutual Funds...]
Unfortunately, this was just a tip of the iceberg as a number of companies, DHFL, Reliance ADAG group companies, and Zee shared a similar fate.
Owing to these cases, Debt Mutual Funds were drastically hit since several fund houses had been holding debt instruments issued by these downgraded corporates in an endeavour to achieve higher returns as compared to the bank FDs.
[Read: Are You Holding Debt Mutual Funds With Stressed Assets?]
But this credit risk the fund managers had taken didn't bode well for the investors and erased the illusion that debt fund investment is safe. Many fund houses to safeguard the investors' interest, did resort to Side pocketing and SEBI implemented corrective measures to make portfolio valuations of debt funds more reflective of a realisable value to take a haircut.
But this has proved to be futile; the damage done to the investors' portfolios was far too much. Finally, the only way investors had out of this sticky mess was the redemption of their debt fund investments.
this heavy redemption is indicated by the monthly figures the AMFI shared.
The proportionate share of debt-oriented schemes is down to 28.3% of the industry in June 2019, from 33.3% in June 2018; even on a monthly basis, it shrank from 28.8% in May 2019 to 28.3% in June 2019. Whereas the proportionate share of equity-oriented schemes is at 42.3% of the industry assets in June 2019, from 41.2% in June 2018.
[Read: What Enabled Investors To Prefer Investing In Equity Funds In Month of June?]
Graph 1: Scheme-wise Composition of Assets
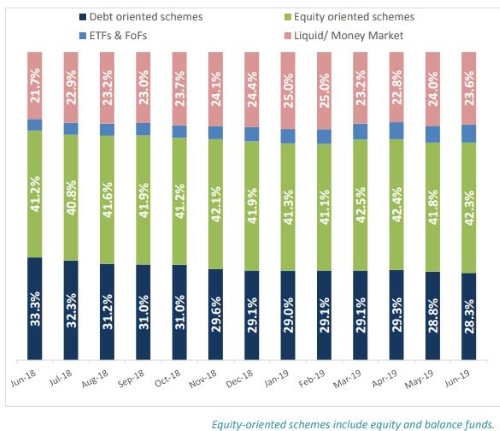
Data as of June 30, 2019
(Source: www.amfiindia.com)
Although the assets managed by the Indian mutual fund industry have grown by a 9.52% over a year (from Rs 23.57 trillion in June 2018 to Rs. 25.81 trillion in June 2019), and on a month-on-month basis, it grew by meagre 2% from Rs 25.43 trillion to Rs. 25.81 trillion in June 2019.
Graph 2: Slow growth in Total Assets (Rs in Trillion)
-graph-2.JPG)
Data as of June 30, 2019
(Source: www.amfiindia.com)
The total number of accounts (or folios as per mutual fund parlance) as on June 30, 2019, stood at 8.38 crore (83.8 million), while the number of folios under Equity, Hybrid, and Solution Oriented Schemes, wherein the maximum investment is from retail segment stood at 7.56 crore (75.6 million).
Table 1: Monthly rise in No. of Folios (in crore)
| Months |
No. of folios |
| Mar-19 |
8.25 |
| Apr-19 |
8.27 |
| May-19 |
8.32 |
| Jun-19 |
8.37 |
Data as of June 30, 2019
(Source: www.amfiindia.com)
The number of open-ended debt folios touched 5.3 crores in June 2019 from 5.2 crores in April 2019. Within the sub-category, liquid funds saw a heavy outflow of Rs 152431.65 crore as compared to April inflow of Rs 89,778.43. A whopping drop of 69.8% shows that investors are losing interest and have almost abandoned debt mutual funds to achieve their short-term investment goals. Instead, they are turning back to vanilla investments for the short-term needs.
[Read: Factors To Look At While Investing In Bank FDs]
Table 2: Inflow/outflow of open-ended debt funds for consecutive three months (Rs in crore)
| Open ended debt Schemes |
Apr-19 |
May-19 |
Jun-19 |
| Overnight Fund |
95.74 |
2,347.41 |
-4,062.55 |
| Liquid Fund |
89,778.43 |
68,582.91 |
-152,431.65 |
| Ultra-Short Duration Fund |
11,037.26 |
1,190.85 |
-1,926.12 |
| Low Duration Fund |
4,913.30 |
-2,353.30 |
-4,689.22 |
| Money Market Fund |
6,418.52 |
3,895.77 |
-3,831.97 |
| Short Duration Fund |
2,770.57 |
-1,316.20 |
-607.48 |
| Medium Duration Fund |
-530.89 |
-2,063.18 |
-1,158.81 |
| Medium to Long Duration Fund |
264.14 |
387.21 |
-156.34 |
| Long Duration Fund |
8.06 |
90.48 |
22.37 |
| Dynamic Bond Fund |
411.9 |
-651.16 |
-786.32 |
| Corporate Bond Fund |
3,874.40 |
1,429.98 |
-131.18 |
| Credit Risk Fund |
-1,253.28 |
-4,155.80 |
-2,694.87 |
| Banking and PSU Fund |
2,792.15 |
3,381.82 |
799.39 |
| Gilt Fund |
-40.86 |
-44.59 |
196.76 |
| Gilt Fund witd 10-year constant duration |
33.1 |
-61.15 |
44.54 |
| Floater Fund |
347.73 |
232.8 |
64.13 |
| Total |
120920.3 |
70893.85 |
-171349.32 |
Data as of June 30, 2019
(Source: www.amfiindia.com)
Low Duration Funds, Overnight Funds, Money Market Funds, Credit Risk Funds, Ultra Short Duration Funds and Medium Duration Funds too saw a heavy outflow of Rs 4,689.22 crore, Rs 4,062.55 crore, Rs 3831.97 crore, Rs 2694.87crore, Rs 1926.12 crore, and Rs 1158.81 crore respectively among other debt funds.
Image 1: Individual Investor composition through distributor and direct route
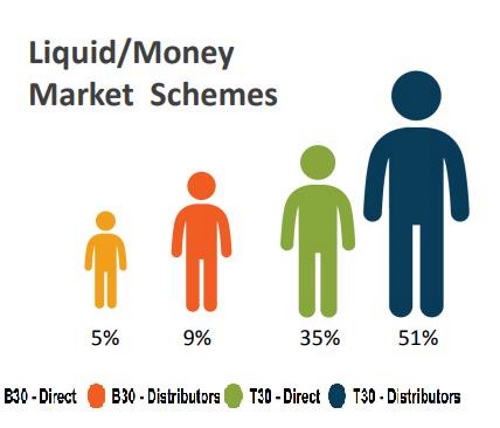
Data as of June 30, 2019
(Source: www.amfiindia.com)
While the capital market regulator gave the fund houses multiple opportunities to adopt better fund management processes and expected them to observe stricter self-regulatory processes. Unfortunately, mutual fund houses did not heed to the market regulator's directives.
The Capital Market regulator was left with no other choice but to take stringent action on the risk management processes mutual fund houses followed, and rightly so. After all, protecting investors' interest is one of its topmost priorities.
At the board meeting, the capital market regulator introduced a slew of new regulations that intend to make debt mutual funds a lot safer place for investors. Graded exit load imposed on liquid funds along with limits set forth on the exposure of instruments held might turn out to be a game-changer.
It's noteworthy that around 1/5th of industry's AUM lies with liquid funds, and according to media reports, nearly 30% of the money flowing into liquid funds moves out within the first seven days.
Besides capping exposure on debt instruments with credit enhancements will make it impossible to mask the risk with unreliable credit enhancement, thereby offering more security to investors. And all debt and money market instruments will have to value their portfolio on a mark-to-market basis now. this decision to make valuations based on amortization obsolete will ensure the NAVs of debt funds are more transparent.
Conclusion:
What is important for an investor is, that Debt investment isn't risk-free. So, when you invest, keep your eyes wide open, pay attention to the portfolio characteristics and quality of the scheme. Prefer safety of principal over return. Stick to mutual funds where the fund manager doesn't chase returns by taking higher credit risk. Further, asses your risk appetite and investment time horizon while investing in debt funds. thoroughly research to understand the inherent risk of the fund you want to invest in for your financial well-being.
PS: Here is a strategy that has the potential to beat the markets in the next 7-8 years.
Our 'Strategic Funds Portfolio for 2025' is backed by the 'core and satellite' approach of investing that many successful investors have adopted for long-term wealth creation.

If you're an investor looking for "decent investment gains at relatively moderate risk", PersonalFN's Premium Report "the Strategic Funds Portfolio For 2025" could be the ready-made solution for you.
Click here to know more and subscribe.
Add Comments