 (Image source: Image by Nattanan Kanchanaprat from Pixabay)
Value-investing is all about finding `diamond in the rough'. This approach aims to invest in stocks that are trading below their intrinsic value but have the potential to grow over time due to strong business fundamentals. When the stocks in the portfolio realise their true worth, investors are rewarded with higher gains.
ICICI Prudential Value Discovery Fund is among the handful of funds that follow value-based approach to investing. The fund was launched on August 16, 2004 and has an AUM of Rs 16,185 crore, the highest in the category.
As per the SEBI mandate, value funds should follow a value investment strategy and invest minimum 65% of total assets in equity and equity related instruments.
The fund is managed by Mr Mrinal Singh who is associated with the scheme since February 2011, whereas Ms Priyanka Khandelwal looks into the overseas investment of the fund.
In this brief analysis, we take a close look at the features and performance of ICICI Prudential Value Discovery Fund.
Investment objective of ICICI Prudential Value Discovery Fund
The investment objective of the scheme is to generate returns through a combination of dividend income and capital appreciation by investing primarily in a well-diversified portfolio of value stocks.
Table 1: Fund Facts ICICI Prudential Value Discovery Fund
| Category |
Value Funds |
Style |
Value |
| Type |
Open ended |
Market Cap Bias |
Large cap |
| Launch Date |
16-Aug-2004 |
SI Return (CAGR) |
19.03% |
| Corpus (Cr) |
Rs 16,185 |
Min./Add. Inv. |
Rs 1,000 / Rs 500 |
| Expense Ratio (Dir/Reg) |
1.25% / 1.89% |
Exit Load |
1% |
Portfolio Data as on June 30, 2019.
SI Return as on August 07, 2019.
(Source: ACE MF)
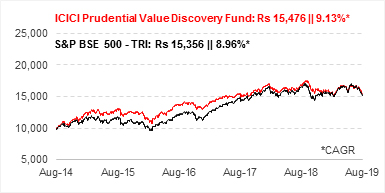
Graph 1: Growth Of Rs 10,000, If Invested In ICICI Prudential Value Discovery Fund 5 Years Ago
Data as on August 07, 2019
(Source: ACE MF)
If you had invested Rs 10,000 in ICICI Prudential Value Discovery Fund five years back on August 06, 2014, it would have grown to Rs 15,476 as on August 06, 2019. This translates into compounded annualised growth rate of 9.13%. In comparison a simultaneous investment of Rs 10,000 in its benchmark - S&P BSE 500 - TRI index would now be worth Rs 15,356 (a CAGR of 8.96%). As can be seen in the chart, the fund was able to outperform the benchmark between the end of 2014 and the end of 2017. From there onwards the alpha started diminishing and now the fund's performance is in line with the benchmark.
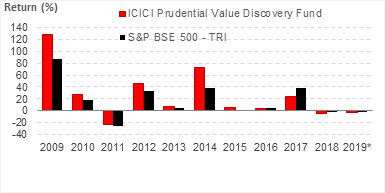
Graph 2: ICICI Prudential Value Discovery Fund: Year-on-Year Performance
YTD as on August 07, 2019
(Source: ACE MF)
The year-on-year performance comparison of ICICI Prudential Value Discovery Fund with its benchmark S&P BSE 500 - TRI shows that the fund has outperformed the benchmark in the last 7 out of 10 calendar years. While the fund outperformed the benchmark with significant margin from CY 2009 to CY 2015, it consistently lagged the benchmark from CY 2016 onwards. The fund failed to manage downside risk in CY 2018 and has trailed even in the current year 2019.
Table 2: ICICI Prudential Value Discovery Fund: Performance vis-à-vis category peers
Returns are on a rolling basis and in %, calculated using Direct Plan - Growth option. Those depicted over 1-Yr are compounded annualised.
(Data as on August 07, 2019)
(Source: ACE MF)
*Please note, this table only represents the best performing funds based solely on past returns and is NOT a recommendation. Mutual Fund investments are subject to market risks. Read all scheme related documents carefully. Past performance is not an indicator for future returns. The percentage returns shown are only for indicative purposes.
ICICI Prudential Value Discovery Fund underperformed its benchmark S&P BSE 500 - TRI in 1-year, 2-year and 3-year rolling period, while it outperformed the index in the 5-year rolling period. Though the fund lagged most of its peers in 2-year and 3-year rolling periods that was dominated by rally in overvalued midcaps, the cautious approach followed by the fund helped it beat the average category returns in 1-year rolling period, where most of its mid-cap biased peers are bleeding red.
The fund was at the bottom of the list when 3-year category rolling returns were compared. The top 3 performers included Tata Equity P/E Fund, JM Value Fund and HDFC Capital Builder Value Fund.
In terms of risk-reward parameters, the fund undertook much lower risk as compared to peers and the benchmark. However, even with low risk the fund could not manage to provide a reasonable risk-adjusted return.
Investment Strategy of ICICI Prudential Value Discovery Fund
The scheme aims to provide long-term capital appreciation by investing primarily in a well-diversified portfolio of companies that are selected based on the criteria of value investing.
The scheme proposes to carefully accumulate a portfolio of stocks, which are available at a discount to its intrinsic value through a process of `Discovery'. The Discovery process involves identification of stocks which have attractive valuations in relation to earnings or book value or current and/or future dividends and are available at price, which can be termed as bargain.
This may constitute stocks, which have depreciated for a short period due to some exceptional circumstance or due to market correction phase or due to lack of interest in investing in a sector, which has significantly underperformed the market. Such stocks are considered to have intrinsic value because of their business models and show potential for smart growth in the future.
The fund determines the intrinsic value of stocks by analysing the financial statements of the companies and parameters such as EPS (Earnings per Share), the Book Value per share, understanding the competition land-scape and business structure of these companies.
The fund uses industry specific valuation measures to evaluate companies in every sector in order to select the most attractive companies for the portfolio.
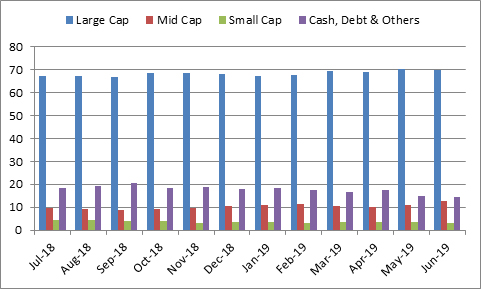
Graph 3: ICICI Prudential Value Discovery Fund Portfolio Allocation And Market Capitalisation Trend
Holdings (in %) as on June 30, 2019
(Source: ACE MF)
ICICI Prudential Value Discovery Fund focuses on identifying under-valued stocks across market caps, though it currently has a large-cap bias with an allocation in the range of 66-70%. With a growing corpus and rising valuations in the mid cap segment in CY 2016-2017, IPVDF was quick to shift its focus from overvalued mid-cap stocks to higher market caps, which impacted its performance during the midcap driven market rally. The funds exposure to mid-caps is between 8-12% while that of small-caps is 3-4%. The fund has been holding significant exposure of over 5% in Nifty - Futures, while the remaining portfolio is held in cash and debt instruments.
Graph 4: ICICI Prudential Value Discovery Fund Top Portfolio Holdings
Holdings (in %) as on June 30, 2019
(Source: ACE MF)
ICICI Prudential Value Discovery Fund has 41 stocks in its portfolio. The top 10 stocks constitute close to 51% of the total holdings and are well diversified across sectors. Infosys has the top allocation in the portfolio at 7.6%, followed by Sun Pharmaceuticals and State Bank of India with an allocation of around 7% each. NTPC (5.8%), HDFC Bank (4.5%) and Indian Oil Corporation (4%) follow closely behind. The other stocks in the top 10 holdings have allocation of 3-4% each.
In terms of sector-wise holdings, the highest exposure is towards Infotech with an allocation of 15.3%. Banking sector is the next highest in the list with an exposure of 12.2%. This is followed by Power (8%), Pharmaceuticals (7.7%) and Auto ancillaries (4.7%).
Top contributors
Among the stocks in the fund's portfolio, Wipro contributed the most to gains of the portfolio in the last one year with a portfolio return of 2%. PI Industries and State Bank of India were the other top contributors to its gains.
The stocks that eroded the portfolio gains the most were Sun Pharmaceuticals, Mahindra & Mahindra and Exide Industries.
Suitability of ICICI Prudential Value Discovery Fund
ICICI Prudential Value Discovery Fund aims for capital appreciation by investing in diversified portfolio of stocks selected based on the criteria of value investing.
As the fund looks for stocks that are trading below their intrinsic value, certain bets of the fund may not pay off immediately and may take time before reflecting their true worth. The stocks are carefully selected by analysing the financial statement of the business and may therefore carry the potential to provide better risk-reward ratio over long-term. The cautious investment approach and high impetus to value, makes it suitable for individuals with moderately high risk appetite and a time horizon of 5-years or more.
The scheme is well-diversified across sectors which along with the focus on value investing can help in reducing the volatility and the risk involved. However, one should weigh all the options and make a prudent choice while investing in mutual funds.
Note: This write up is for information purpose and does not constitute any kind of investment advice or a recommendation to Buy / Hold / Sell a fund. As an investor, you need to pick the right fund to meet your financial goals. If you are not sure about your risk appetite, do consult your investment consultant/advisor. Mutual Fund Investments are subject to market risks, read all scheme related documents carefully.
Editor's note: The last few years have not been among the best for equity mutual funds. While most funds have underperformed or are struggling to match the returns of the benchmark, there are few funds that have the potential to constantly generate alpha for its investors. And we have recently identified five such high alpha generating funds, in our latest report 'The Alpha Funds Report 2019'. Do not miss our latest research finding. Get your access to this exclusive report, right here!
DISCLOSURE AS PER SECURITIES AND EXCHANGE BOARD OF INDIA (RESEARCH ANALYSTS) REGULATIONS, 2014
About the Company including business activity
Quantum Information Services Private Limited (QIS) was incorporated on December 19, 1989.
QIS was promoted by Mr Ajit Dayal with an objective of providing value-based information/views on news related to equity markets, the economy in general, sector analysis, budget review and various personal products and investments options available to the Public. It was the first company to start equity research on an institutional level.
'PersonalFN' is a service brand of QIS and was started in the year 1999. In 1999, the Company registered the Domain name www.personalfn.com for providing information on mutual funds and personal financial planning, financial markets in general, etc. and services related to financial planning and research in various financial instruments including mutual funds, insurance and fixed income products to customers. It offers asset allocation and researched investment recommendations through its financial planning services.
Quantum Information Services Private Limited (QIS) is registered as Investment Adviser under SEBI (Investment Adviser) Regulations, 2013 and having Registration No.: INA000000680. In terms of the second proviso to Regulation 3 (1) of SEBI (Research Analysts) Regulations, 2014 the Company is not required to obtain Certificate of registration from SEBI.
Disciplinary history
There are no outstanding litigations against the Company, its subsidiaries and its Directors.
Terms and condition on which its offer research report
For the terms and condition for research report click here.
Details of associates
-
Money Simplified Services Private Limited;
-
PersonalFN Insurance Services India Private Limited;
-
Equitymaster Agora Research Private Limited;
-
Common Sense Living Private Limited;
-
Quantum Advisors Private Limited;
-
Quantum Asset Management Company Private Limited;
-
HelpYourNGO.com India Private Limited;
-
HelpYourNGO Foundation;
-
Natural Streets for Performing Arts Foundation;
-
Primary Real Estate Advisors Private Limited;
-
Rahul Goel;
-
I V Subramaniam.
Disclosure with regard to ownership and material conflicts of interest
-
Neither QIS, it's Associates, Research Analyst or his/her relative have any financial interest in the subject Company;
-
Neither QIS, it's Associates, Research Analyst or his/her relative have actual/beneficial ownership of one per cent or more securities of the subject Company, at the end of the month immediately preceding the date of publication of the research report;
-
Neither QIS, it's Associates, Research Analyst or his/her relative has any other material conflict of interest at the time of publication of the research report except that QIS (PersonalFN) is, as per SEBI (Mutual Funds) Regulations 1996, an associate / group Company of Quantum Asset Management Company Private Limited and Trustees and Sponsor of Quantum Mutual Fund (QMF) and to that extent there may be conflict of interest while recommending any schemes of QMF. However, any such recommendation or reference made is based on the standard evaluation and selection process, which applies uniformly for all Mutual Fund Schemes. The payment of commission (upfront / annualized & trail), if any, for any Schemes by QMF to QIS (PersonalFN) is also at arm's length and as per prevailing market practices.
Disclosure with regard to receipt of Compensation
-
Neither QIS nor it's Associates have received any compensation from the subject Company in the past twelve months;
-
Neither QIS nor it's Associates have managed or co-managed public offering of securities for the subject Company;
-
Neither QIS nor it's Associates have received any compensation for investment banking or merchant banking or brokerage services from the subject Company;
-
Neither QIS nor it's Associates have received any compensation for products or services other than investment banking or merchant banking or brokerage services from the subject company in the past twelve months.
-
Neither QIS nor it's Associates have received any compensation or other benefits from the subject Company or third party in connection with the research report
General disclosure
-
The Research Analyst has not served as an officer, director or employee of the subject Company.
-
QIS or the Research Analyst has not been engaged in market making activity for the subject Company.
Subject Company means Mutual Fund Schemes
Quantum Information Services Private Limited CIN: U65990MH1989PTC054667 Regd. Office: 103, Regent Chambers, 1st Floor, Nariman Point, Mumbai - 400 021 Corp. Office: 103, Regent Chambers, 1st Floor, Nariman Point, Mumbai - 400 021.
Email:info@personalfn.com Website: www.personalfn.com Tel.: 022 61361200 Fax.: 022 61361222 SEBI-registered Investment Adviser. Registration No. INA000000680, SEBI (Investment Advisers) Regulation, 2013
Add Comments