Market Overview
The Indian equity market (BSE Sensex) in the month of July 2012 was once again engulfed by nervous sentiments as the Euro zone debt crisis gathered pace, and thus the impulse (of +7.5%) seen in the month of June 2012, was partially exhausted as the BSE Sensex lost –1.1%.
At the beginning of the month, the Indian equity markets moved sideways for five trading sessions, but later when the downbeat economic data was disseminated from the developed economies – especially the Euro zone, the market did depict a downward bias. It is noteworthy that this time, detrimental news flows was not only from Greece, Italy and Spain, but also some of the nations in the Euro zone which were perceived to be quite resilient in the Euro bloc. The biggest shock came from the U.K., where the second quarter economic growth rate shrank to -0.7% attributed by fall in the construction sector and weakness in production and services sector. In fact this Q2 economic growth number was worse than -0.2% expected by most economists and was confirmation of Europe’s third largest economy slipping into a recessionary phase. Meanwhile with their Government pressing on tax hikes and spending cuts to reduce debt, also accentuated the worries for Europe’s third largest economy. Likewise with Moody’s lowering German economy’s (the largest and most pivotal in the Euro zone) outlook from stable to negative, and also lowering outlook for 17 German banks (since several of them held debt that was guaranteed by the German central or regional Governments), also sent stark warnings to global markets, that no economy is immune from the Euro zone debt crisis. As far as Spain is concerned, their borrowing rates spiked to a level over 7% which are considered unsustainable in the long-term, which also surmounted the worries in the Euro zone; because bailing out Spain (the fourth largest economy in the Euro zone) would cost more than was splashed out saving Greece, Ireland and Portugal from bankruptcy. Thus now the focus and pressure is on Spain, as it is struggling to get its public finances under control at a time when their economy is treading through a recessionary phase and facing a double-digit unemployment rate (24.6% in second quarter of 2012). However at the end of the month gone by, a statement from Mr Mario Draghi (President of the European Commercial Bank) which read, "Within our mandate, the ECB is ready to do whatever it takes to preserve the euro. And believe me, it will be enough," helped to lift sentiments in the global markets towards the tail of the month gone by.
Speaking about the U.S., their second quarter GDP growth number too was quite dismaying source of economic data as it expanded by mere 1.5%, according to the estimates (released by the Bureau of Economic Analysis, in July 2012), thus forming a descending trend for the last two quarters of the year 2012 and manifesting poor economic growth.
Back home in India, the downbeat domestic economic data too governed the sentiments of the Indian equity markets. The submissive Index of Industrial Production (IIP) data (prevailing since quite some time now), sticky Wholesale Price Index (WPI) inflation (over the comfort zone of RBI) clubbed with deficient monsoon added to nervous sentiments in the Indian equity markets since it escalated worries of WPI inflation once again shooting. Likewise increase in fuel products such as petrol, diesel, kerosene and cooking gas (LPG) in seven states also added to the woes, as it construed to have bearing on headline (i.e. WPI) inflation. And thus recognising the detrimental impact of this and deficiency along with unevenness in monsoon, the Reserve Bank of India (RBI) in its 1st quarter review of monetary policy refrained from reducing policy rates. However, in order to facilitate smooth flow of credit to productive sectors to support growth and Government’s disinvestment program, the Statutory Liquidity Ratio (SLR) of scheduled commercial banks was reduced by 100 basis points (bps) i.e. from 24% to 23%. The central bank in the said monetary policy review meet also placed an upward revision to WPI inflation target for the fiscal year 2013 from 6.5% to 7.0%, taking into account the bearing of deficient monsoon and recent upward trend in global fuel prices. Likewise the GDP growth target for the fiscal year 2013 was also revised downwards to 6.5% (from 7.3% as set out in April 2012 policy), taking into account host of global as well as domestic economic factors.
In the month gone by, as far as the prices of gold are concerned, since the turbulence persisted in the global economy and domestic economic data too was downbeat, the precious yellow continued to trace upwards (gained +1.2%) as smart investors preferred to take refuge. The weakness in the Indian rupee against the U.S. dollar also aided gold to maintain its sheen.
Speaking about Brent crude oil, after going through a pretty elongated corrective phase (which resulted in price remaining below the U.S. $100 mark until June 2012), prices ascended over the U.S. $100 mark – gaining +17.4% on concerns over supply from the Middle East and the North Sea. However, the slowdown in the global economy restrained the ascending move for Brent crude oil. But going forward, Brent crude oil is expected to move gradual upwards for ensuing at least two months, due to production cut in September 2012 for maintenance work in the British sector of the North Sea. Moreover, tensions in Middle East – especially Syria, and halt of oil exports on August 31, 2012 by Iraq’s semi-autonomous region of Kurdistan (if the central government does not make all outstanding payments) could also add to the supply uncertainty, thereby putting upward pressure on Brent crude oil prices.
For the bond markets the month gone was filled with sufficient liquidity. Thus the short-term papers witnessed some drop in yields, whereby the 1-month CD yield mellowed by 55 basis points (bps) while the 3-month CD yield mellowed by 20 bps. But during the last week of the month gone by, the short-term yields depicted a gentle up-move as the bond markets had estimated that RBI would not reduce policy rates in its 1st quarter review of Monetary Policy 2012-13 since WPI inflation for the month of June 2012 (data released in July 2012) although reduced marginally still continued to be over the comfort zone of RBI. And indeed when RBI kept the policy rates unchanged in policy meet, short-term yields depicted an impulse, as the central bank guided that it would not lower policy rates immediately since inflationary pressures persist. The 10-Yr G-sec ended the month with no change in level of yield. Going forward yields of short-term papers could depict a gentle up-move, at least until the central bank reduces policy rates, if inflation permits it to do so. Likewise the 10-Yr G-sec yield will also be susceptible to a gentle upside it inflation and fiscal deficit is not contained.
Monthly Market Roundup
|
As on July 31, 2012 |
As on June 30, 2012 |
Change |
% Change |
| BSE Sensex |
17,236.18 |
17,429.98 |
(193.80) |
-1.1%  |
| S&P CNX Nifty |
5,229.00 |
5,278.90 |
(49.90) |
-0.9% |
| CNX Midcap |
7,168.50 |
7,351.80 |
(183.30) |
-2.5% |
| Gold (Rs/10 gram) |
29,980.00 |
29,610.00 |
370.00 |
1.2%  |
| Re/US $ |
55.66 |
55.64 |
(0.02) |
0.0% |
| Crude Oil ($/BBL) |
107.33 |
91.40 |
15.93 |
17.4% |
| 8.15% 2022 (10-Yr) G-Sec Yield (%)* |
8.17 |
8.17 |
0.00 |
0.0% - |
| 1-Yr FDs |
7.25% - 9.25% |
*The 8.15% 2022 is the new 10-Yr benchmark which was introduced on June 9, 2012
(Monthly change as on July 31, 2012)
(Source: ACE MF, PersonalFN Research)
Foreign Institutional Investors (FIIs) participation in the Indian equity market was quite heartening. Despite the aforementioned economic factors – both global as well as domestic, FIIs exuded confidence in the Indian equity market, as they net bought to the tune of Rs 9,067 crore, thereby bucking their June 2012 activity where they net sold to the tune of Rs 501 crore.
BSE Sensex vs FII inflows

(Source: ACE MF , PersonalFN Research)
Thus it seems that amid gloomy outlook in the Euro zone and timid economic recovery in the U.S., they (FIIs) were in search of attractive investment destinations in the Emerging Market Economies (EMEs), and India was one of them.
Mutual Fund Overview
However, domestic mutual funds on the other hand after being cautious net buyers for last couple of months (to the tune of Rs 834 crore), turned to be net sellers in the Indian equity markets to the tune of Rs 1,710 crore. Fund managers seemed to be cautious about the Euro zone debt crisis and its rippling and crippling effect on the Indian economy. Moreover, the domestic data too wasn’t very encouraging for them to buy in the Indian equity markets and redemption pressures too were imminent as investors remained cautious.
BSE Sensex vs MF inflows

(Source: ACE MF, PersonalFN Research)
As far as the performance of various categories of mutual funds is concerned, despite the lull in the market gains were seen in some of the diversified equity funds category, especially those following multi-cap and flexi-cap trait in their portfolio holdings.
Among the sector funds, pharma funds took the lead followed by those following the media and entertainment and consumption theme. However, most mutual fund schemes with a mandate of investing in infrastructure and technology sector / theme took a hit, due to detrimental undercurrents for these sectors.
In the Fund of Fund (FoF) schemes, the offshore ones delivered luring returns despite uncertainty in the global economic environment.
Speaking about the hybrid funds; in balanced funds category only a few of them managed to deliver gains in the month gone by as they remained vulnerable to the underlying currents of the equity markets. However in the Monthly Income Plans (MIPs) category, gains were seen across funds aided by drop in yields of shorter maturity papers just before the last week on the month (where the bonds markets expected that RBI may not reduce policy rates in its 1st quarter review of monetary policy 2012-13, as inflationary pressures persisted).
Monthly top gainers: Open-ended equity funds
| Diversified Equity Funds |
1-Mth |
Sector Funds |
1-Mth |
ELSS |
1-Mth |
| Sundaram Equity Multiplier (G) |
3.50% |
SBI Magnum Pharma (G) |
5.27% |
IDFC Tax Saver (G) |
2.16% |
| SBI Magnum Emerging Businesses (G) |
3.03% |
UTI Pharma & Healthcare (G) |
3.96% |
SBI Tax advantage-II (G) |
2.04% |
| Tata Equity Mgmt (G) |
2.84% |
Reliance Pharma (G) |
3.86% |
JM Tax Gain (G) |
1.91% |
(1-Mth returns as on July 31, 2012)
(Source: ACE MF, PersonalFN Research)
Monthly top gainers: Open-ended Fund of Funds
| Fund of Funds |
1-Mth |
| JPMorgan JF ASEAN Eq Off-shore Fund (G) |
5.26% |
| DSPBR World Energy (G) |
3.85% |
| JPMorgan Emerg Eur Mid East & Afr Eq Off-shr Fund (G) |
3.50% |
(1-Mth returns as on July 31, 2012)
(Source: ACE MF, PersonalFN Research)
Monthly top gainers: Open-ended Hybrid Funds
| Balanced Funds |
1-Mth |
Monthly Income Plans |
1-Mth |
| SBI Magnum Balanced (G) |
2.46% |
Tata MIP Plus (G) |
1.27% |
| Tata Balanced (G) |
1.77% |
DSPBR MIP (G) |
1.16% |
| Tata SIP-S3 (G) |
1.09% |
Sundaram MIP-Aggr (G) |
1.14% |
(1-Mth returns as on July 31, 2012)
(Source: ACE MF, PersonalFN Research )
Monthly top gainers: Open-ended debt funds
| Floating Rate Funds |
1-Mth |
Income Funds |
1-Mth |
Gilt funds |
1-Mth |
| Short Term |
|
Short Term |
|
Short Term |
|
| Reliance FRF ST (G) |
0.93% |
Birla SL ST Opp-Ret (G) |
1.46% |
SBI Magnum Gilt-STP (G) |
0.79% |
| DSPBR Income Opportunities-Reg (G) |
0.89% |
Birla SL ST (G) |
1.09% |
HDFC Gilt-ST (G) |
0.77% |
| Principal Debt Opp Fund-Cons Plan (G) |
0.85% |
SBI SHD-ST-Ret (G) |
1.05% |
Edelweiss Gilt (G) |
0.76% |
| Long Term |
|
Long Term |
|
Long Term |
|
| HDFC FRIF-LT (G) |
0.95% |
Birla SL Medium Term-Reg (G) |
1.40% |
L&T Gilt - Investment (G) |
1.31% |
| Templeton FRF Income (G) |
0.84% |
SBI Magnum Income (G) |
1.31% |
Sundaram Gilt Fund-Reg (G) |
0.92% |
| Birla SL FRF-LT (G) |
0.83% |
HDFC Medium Term Opp (G) |
1.20% |
DWS Gilt Fund-Reg (G) |
0.90% |
| Liquid Funds |
1-Mth |
Liquid Plus funds |
1-Mth |
| Escorts Liquid Plan (G) |
0.87% |
Principal Bank CD (G) |
0.90% |
| IDFC Ultra ST (G) |
0.82% |
Reliance Medium Term (G) |
0.88% |
| Daiwa Liquid-Reg (G) |
0.82% |
Indiabulls Ultra Short Term Fund (G) |
0.86% |
(1-Mth returns as on July 31, 2012)
(Source: ACE MF, PersonalFN Research )
Thus Debt mutual funds, across categories and tenure also showed a decent performance in the month gone by, as yields for short-term debt papers had started mellowing down (as cited above), while long-term debt papers witnessed a very narrow range bound yield movement.
It is noteworthy that FIIs too continued to exude confidence in the Indian debt markets as seen in the month of June 2012 (where they net bought to the tune of Rs 1,682 crore) as they bought net to the tune of Rs 3,266 crore. Domestic mutual funds on the other hand, bought in the Indian debt market net to the tune of Rs 8,543 crore, thereby lowering aggression as seen in June 2012 (where they net bought Rs 74,371 crore).
Performance across various categories of mutual funds
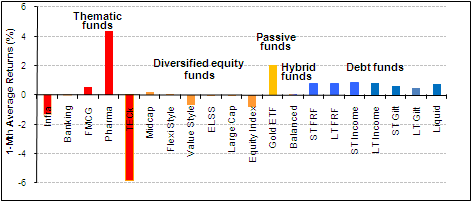
(1-Mth average returns of funds in various categories as on July 31, 2012)
(Source: ACE MF, PersonalFN Research)
The graph above depicts how various categories of mutual funds performed in the previous month. Amongst the sector and thematic funds, tech funds were the one which took the maximum hit followed by those mandated to invest in the infrastructure theme. Among the diversified equity funds, mid cap funds and the one having positioned their portfolio the flexi-cap style managed to report petite gains. However the rest of the funds in terms of market cap bias and styles, ended the month with losses.
Tracing with upward movement of prices of precious yellow metal – gold, Gold ETFs too exhibited positive returns for investors (gaining by an average of +2.0%). Likewise debt mutual funds across categories gained from the yield movements of short-term and long-term debt papers (as explained earlier).
Other News and New Fund Offers
- In its efforts to reduce debt mutual funds’ overexposure to specific sectors, the Securities and Exchange Board of India (SEBI) may, on the recommendations of the Mutual Fund Advisory Committee impose a sector cap on the debt mutual fund schemes. At present there is no such sectoral cap. Each fund house decides how much it will invest, in which sector. The proposal to impose a sector cap on the debt mutual fund schemes has been raised after the SEBI observed several debt funds, especially Fixed Maturity Plans (FMPs), were taking huge exposure in specific sectors, raising worries about systemic risk.
The advisory committee has recommended a cap on debt schemes’ exposure to any sector at 30% with an aim to reduce exposure of debt schemes to non-banking finance companies (NBFC), as they have the largest exposure, followed by banking and public sector undertakings (PSU). To know the impact of this news please click here.
- After four months of deliberations between the mutual fund industry, the Finance Ministry and the capital market regulator - Securities and Exchange Board of India (SEBI), on whether to include mutual funds (MFs) in Rajiv Gandhi Equity Savings Scheme (RGESS); it has now been finally decide by the Finance Ministry that the mutual funds will remain out of the ambit of RGESS, dashing all hopes of the MF industry to find a replacement for their Equity Linked Savings Scheme (ELSS).
- The capital market regulator - Securities and Exchange Board of India (SEBI) is mulling ways to encourage mutual fund houses to launch pension plans. However, for launching a pension plan or providing pension option under a particular mutual fund scheme, according to SEBI, the mutual fund scheme must have a track record of at least five years. Moreover, investors would not be permitted to withdraw in between, and such an option will be available only in a growth plan and not a dividend plan, since the pension corpus is meant to accumulate.
We believe that Pension Products require long-term commitment from investors on one hand and professional fund management on the other. And with the mutual fund industry being one of the well regulated industries it would be a prudent step to introduce pension products under the roof of mutual fund industry.
However, care should be taken by the SEBI while structuring pension plans under mutual fund schemes as these (pension plans) would be subscribed to by the investors from their retirement planning point of view. Also, there should be similar and clear tax benefits to pension plans from mutual funds and other pension products in order to encourage mutual fund houses to launch more of such products.
Investors should keep in mind that retirement planning is an integral part of the financial planning exercise and must be undertaken keeping in mind one's risk taking ability, income, expenses, number of dependents, etc.
- The capital market regulator - Securities and Exchange Board of India (SEBI) is planning to deny approval to new offerings from fund houses whose schemes have been consistently underperforming over the last few years. SEBI hopes that this will put pressure on such mutual funds to deliver returns closer to or better than the benchmark indices. To know what SEBI is planning to rein in underperforming mutual funds, please click here.
- IDBI Mutual Fund introduced an open-ended gold fund of fund scheme, named "IDBI Gold Fund” (IGF) that is mandated to invest its corpus in IDBI Gold ETF. As per the offer document, IGF’s investment objective is "To generate returns that correspond closely to the returns generated by IDBI Gold Exchange Traded Fund (IDBI GOLD ETF).” IGF is mandated to invest 95% - 100% of its assets in Units of IDBI Gold Exchange Traded Fund and upto 5% in Reverse Repo/ Short-Term Fixed Deposits/ Money Market Instruments and in IDBI Liquid Fund Scheme of IDBI Mutual Fund.
- DSP BlackRock Mutual Fund added to its stable an open-ended equity fund of fund (FoF) scheme – "DSP BlackRock US Flexible Equity Fund” (DUFEF) mandated to invest predominantly in units of BlackRock Global Funds US Flexible Equity Fund (BGF - USFEF) – the underlying fund. Thus the fund (i.e. DBUFEF) provides access one of the largest equity markets in the world – the US, (on the basis of market capitalisation) which has companies who have depicted huge innovation and have led many global trends and investment themes. As per the offer document, DUFEF’s is "to seek capital appreciation by investing predominantly in units of BlackRock Global Funds US Flexible Equity Fund (BGF - USFEF). The Scheme may, at the discretion of the Investment Manager, also invest in the units of other similar overseas mutual fund schemes, which may constitute a significant part of its corpus. The Scheme may also invest a certain portion of its corpus in money market securities and/ or money market/liquid schemes of DSP BlackRock Mutual Fund, in order to meet liquidity requirements from time to time. However, there is no assurance that the investment objective of the Scheme will be realized.” The fund in order to benchmark its performance uses Russell 1000 Index, which measures the performance of large cap segment of the US equity universe, and represents approximately 92% of the US market.
Disclaimer: This note / article is for information purposes and Quantum Information Services Pvt. Limited (PersonalFN) is not providing any professional / investment advice through it. The recommendation service, views, articles and other contents are provided on an "As Is" basis by PersonalFN. The facts mentioned in the note are believed to be true and from a public source. The Service should not be construed to be an advertisement for solicitation for buying or selling of any scheme / financial product. PersonalFN disclaims warrants of any kind, whether express or implied, as to any matter/content contained in this note, including without limitation the implied warranties of merchantability and fitness for a particular purpose. PersonalFN and its subsidiaries / affiliates / sponsors / trustee or their officers, employees, personnel, directors will not be responsible for any direct/indirect loss or liability incurred by the user as a consequence of his or any other person on his behalf taking any investment decisions based on the contents of this note. Use of this note is at the user's own risk. The user must make his own investment decisions based on his specific investment objective and financial position and using such independent advisors as he believes necessary. PersonalFN does not warrant completeness or accuracy of any information published in this note. All intellectual property rights emerging from this note are and shall remain with PersonalFN. This note is for your personal use and you shall not resell, copy, or redistribute this note, or use it for any commercial purpose. Please read the terms of use.
Add Comments