Click here to understand ‘Risk’
Aug 01, 2022
Author: Ajit Dayal
Risk is a four-letter word - and so is 'Luck'.
Another four-letter word is 'Plan'.
But before I draw a connection between Risk, Luck, and Plan - a reminder of the definition of 'risk'.
According to the Oxford Dictionary, when used as a noun (a noun is a word that refers to something) risk is a situation involving exposure to danger. For example, 'There is a risk in investing in stock markets.'
When used as a verb (a verb is a word that describes an action) risk means to expose (someone or something valued) to danger, harm or loss. For example, 'Unknown to you fund managers of mutual funds are making risky bets with your investments'.
The Honest Truth is that Risk, like beauty, cannot be articulated into a mathematical grid or equation and tucked away into a corner box. It is something qualitative - not quantitative.
For decades, the field of finance has misled investors by claiming that they know how to measure risk. They don't - mostly because risk cannot be calculated or measured. But with an MBA or a CFA to back them up, academia has brainwashed millions of financial folks to believe they can measure risk and report risk. In their desire to find an answer to everything and place everything neatly in a box, packaged into a grid, and made simple academia swopped down on 'volatility' as a measurement of risk.
Risk or Volatility?
What the field of finance has done is convert risk into 'volatility' - the up and down movement of a share price of a stock or commodity or the NAV of a mutual fund. And that is a dangerous and inaccurate substitution of risk.
A measure of the behaviour of change in the price of a share or the NAV of a mutual fund, tells you very little about the possible underlying risk inherent in that share or mutual fund. It may, however, give you an indication about the bumpiness of the ride if you remain invested in that share or mutual fund.
Let me give you a few examples by comparing the data for Infosys, Reliance, and the Quantum Gold Fund.
Graph 1: Infosys: should you make a buy/sell judgement based on 'volatility'?
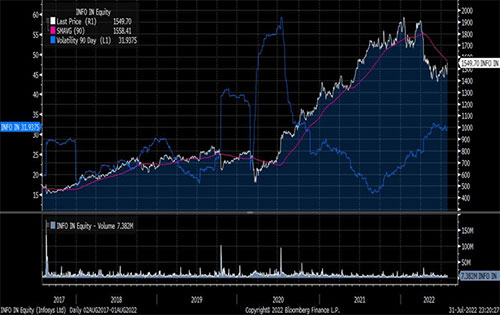 (Source: Bloomberg)
The share price of Infosys has surged approximately 3x over the past 5 years. The 90-day moving average, which removes the sharp daily price movements and plots a longer-term line showing the avg price on a rolling 90-day basis, shows a gently sloping upward curve - then a decline during Covid (the daily share price fell sharply) - and then a quickening pace of gains as share prices surged after the first lockdown in June 2020.
By January 2022 there is fatigue in the daily share price and by March 2022, the 90-day moving average starts a decline. The 90-day volatility numbers are, as one would expect, all over the place because this really measures the changes in the price of Infosys. Note how, when the share price has a clear direction - upwards or downwards - volatility actually declines. The consistency of the direction reduces volatility; intuitively, if something that is rising, keeps on rising - it is being consistent and, by definition, has lower volatility. When there is a directional change - say in October 2019 when the share price declined - then volatility surges. Or, when there is a directional change - say in April 2020 - volatility again surged. At no point does volatility measure the 'risk' of the business of Infosys.
The risk of the businesses to Infosys were and are:
-
In October 2019, there was a whistleblower case that triggered the share price decline, and volatility increased;
-
In February - March 2020, we were hit by the China virus, Covid, and we were all in an uncertain era and share prices declined so this directional change caused higher volatility;
-
By April 2020, we saw a surge in online activity and there was expectation that companies like Infosys will benefit, and the share price changed direction and surged - so volatility increased;
-
Since January 2022, the US central bank (the Fed) and other major central banks are focused on fighting inflation and are increasing interest rates from decade-low levels. There is a fear that the economy will slow and Infosys will have lower business growth. Again, a directional change in share price resulted in higher volatility.
Interestingly, if you bought Infosys shares when volatility was high (due to a directional change in share price) and held on for some months, you would have made money. If you bought Infosys in August 2017, October 2018, October 2019, and April 2020 - when volatility was surging, you would have made money. If volatility was high risk, an investor would assume that it is probably not a good time to buy the stock and would have missed out on potential returns.
If you had bought Infosys in September 2021 when volatility was at a low point, you would be just about breaking even. If volatility was measuring the risk to be low, then why did a low-risk situation result in a low profit or break even?
Here are 2 more charts of Reliance and the Quantum Gold Fund for the same 5-year time period, showing the same 3 graphs: (a) the daily price chart, (b) the 90-day moving average of the share price, and (c) the volatility over a 90-day period.
Graph 2: Reliance: can you spot the risk - or is volatility not really a measurement of risk?
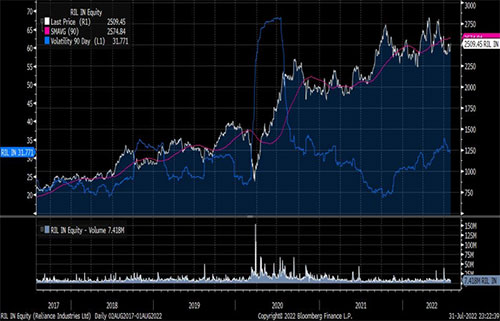 (Source: Bloomberg)
Graph 3: Quantum Gold Savings Fund - does volatility really measure the risk of the financial system?
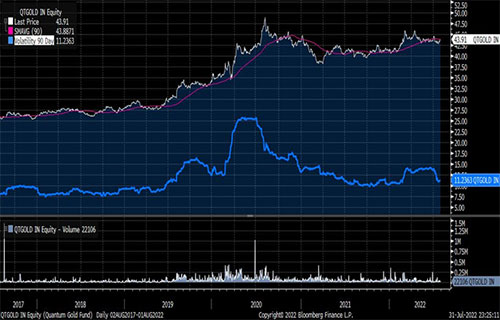 (Source: Bloomberg)
What do the financial firms work towards?
Volatility is not risk.
It is possibly a useful measurement for those who wish to punt and speculate in shares, bonds or commodities. For a long-term investor, it is an inferior guide to understanding and evaluating risk.
At no point did a volatility measure predict the true risks of facing a company like Infosys: its ability to retain and retrain talent, its ability to win mandates, the impact of a slowing global economy, technological shifts that may impact its ability to stay relevant to clients, or the US Dollar to INR foreign exchange rate - to name a few. These are the real questions investors need to ask and be aware of.
One should question why the financial world - be it academia or the students who graduate with MBAs and CFAs - spend all their time talking about, measuring and highlighting volatility when - for most sensible, long-term investors - what happens to the up and down price of a share or the NAV of a mutual fund is of no interest?
Part of the reason may be the fees and commissions.
Financial firms earn money based on trading activity.
Volatility is a good instrument for them to prod you into action - in the misguided proxy of pretending it is calculating risk.
But volatility generates trades and creates a system of individuals relying on the financial firms to guide them on the next steps in their journey of 'investing' - or, rather, speculating.
The derivatives, the options, and the 'vol trades' are the money-spinning engines of financial firms focused on generating ideas for near-term investment outcomes. The 80/20 rule for most businesses probably applies to the field of finance: 80% of the customers generate 20% of the revenues - is that why 20% of customers who can generate the 80% of the revenues are the focus of their attention?
But for those embarking on a true, long term-path to making deliberate, calibrated investments for specific long-term wealth creation - or keeping aside money for a specific goal, there are simple tools that may help you achieve what you want - without any chinta over 'the why', 'the what' or 'the vol' popularised by the financial industry!
Which leads me to the 3 words: Risk, Luck, and Plan.
Using Volatility as an investment decision-making tool may really be a way of letting Luck decide the outcome of your bet.
However, understanding Risk and then Planning your investments is a far superior way to control your own financial destiny.
A word of further caution: a sensible and thoughtful investor should NOT be an investor in one style of investing, in one approach, in one asset class, and you must allocate your savings across a few asset classes to build long-term wealth. Despite my love for value investing, I have diversified my own investments in the Quantum Mutual Fund complex using their simple-to-use calculator which has a base suggestion of 12 20 80; namely, 12 months of expenses kept aside in safe, liquid, and lower return Quantum Liquid Fund; 20% of the balance in the Quantum Gold Savings Fund and then the 80% in a bouquet of equity funds. For those investors who prefer index-hugging low-cost solutions, the Passive Funds option is a click away.
This is an approximation of my holding as of July 2022.
Table: Baaraa, beess, assi (12 20 80) - and my asli allocation
| Asset class, QMF |
Base Suggestion |
Ajit |
Comment |
| Liquid Fund, safe money |
12 months |
21 months |
|
| Gold, after Liquid Fund |
20% |
25% |
|
| Equity, after Liquid Fund |
80% |
75% |
I have the Multi Asset Fund that has some equity exposure |
| Of which Equity Fund of Fund |
75% |
25% |
|
| Of which Value Fund |
15% |
44% |
I have a Value bias |
| Of which India ESG Fund |
15% |
30% |
I have a 'Values' bias |
| Other: Multi Asset Fund |
0% |
5% |
Alternative to an FD |
Don't get trapped in short-term commentary over 'volatile markets' and discussions over 'volatility'. Stay 'Thoughtful and Deliberate' and make balanced investment decisions for your family and you as you embark on your journey of protecting your capital and enhancing your wealth - do try the 12 20 80 (baaraa, bees, aur assi). And tell me what you think about it...
Ajit Dayal is the Founder of the Quantum Group which includes Quantum Mutual Fund and PersonalFN. Ajit has over 35 years of research and investment experience. An avid writer and speaker, Ajit has been profiled and interviewed by many international and local newspapers, magazines, TV channels and radio shows and is never shy of voicing The Honest Truth. It will change the way you think about your investments.
Sign up here to get The Honest Truth delivered every week into your mailbox. It will change the way you think about your investments.